Glossary
Gross: Unless stated otherwise this value represents the total amount before deducting refunds, and before deducting commissions in the case of sales-related reports.
Net: Unless stated otherwise this value represents the total amount after deducting refunds, and after deducting commissions in the case of sales-related reports. Gross Revenue – (refunds + commissions)

History Totals

Refers to the total blocks displayed at the top of the reports (excluding funnels):
- Current month: Always taken from today’s date, backwards up to and including first day of the month. Selected Date range is ignored.
- X month(s) ago: Always taken from first day of the current month less count of months (X). Selected date range is ignored.
Report Layout:
Based on the date range selected, reports can show in the following format:
>=1 day to <=31 days Displays in days
>1 month (ie more than 31 days) to <=5 months Displays in weeks
>=6 months to <=12 months Displays in months
>12 months Displays in years
Vendor Reports
Vendor Dashboard
Link: https://app.paykickstart.com/
Average Transaction Value: refers to all transactions in the filtered date period and gives you the median value for all of those transactions filtered.
The 12 month field will always show the metric for 12 months.

Average Customer Value: refers to all customers created in the filtered date period and is the average value of a customer spending with you. Customers can have more than 1 transaction which increases the metric.
The 12 month field will always show the metric for 12 months.

Sales summary:
- Commissions value: Gross commissions generated by sales of products the vendor owns. This means it also excludes contract commissions where the logged in user is the partner vendor.
- Commissions %: Gross Commissions / Gross Sales
- Refunds value: Gross refunds for all transactions, including partner sales
- Refunds %: Gross Refund Transaction Count / Gross Sales Count
- Avg. Funnel Conversion Rate: Gross Sales Count / Unique Visits
- Avg. Funnel EPC: Gross sales / Unique Visits
Traffic Summary:
Analysis of the top 5 products’ traffic, determined by all visits to each products’ landing page(s).
NOTE: Products may appear to have the same traffic values if those products share the same landing page.
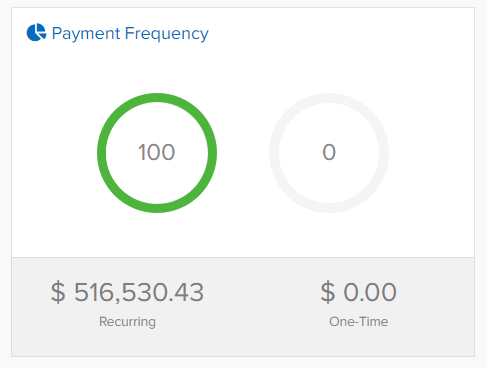
Payment Frequency:
- One time: One-time Sales Less Refunds
- Recurring: Recurring Sales Less Refunds
Best Performing Products:
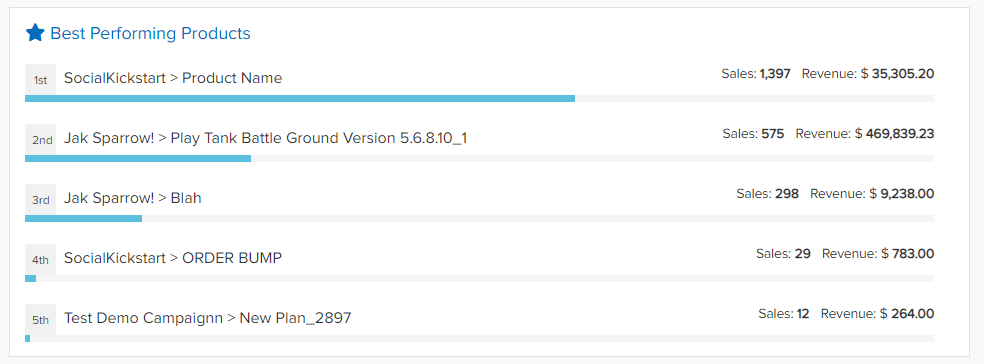
- Sales: Sales Less Refunds Count
- Revenue: Sales Less Refunds Amount
Sales Report
Sales By Month:
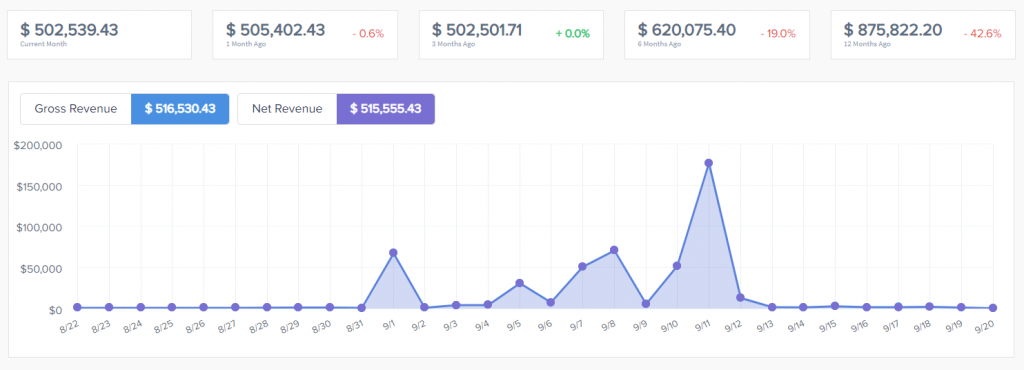
Sales made for the month period. current month to 12 months ago. Always taken from today’s date, back to and including first day of the month. Selected Date range is ignored with this metric.
Gross/Net Revenue:
Gross: The total sales amount before deducting refunds and commissions.
Net: The total sales amount after deducting refunds and commissions. Gross Revenue – (refunds + commissions) = Net Revenue.
Campaign/Product Breakdown:
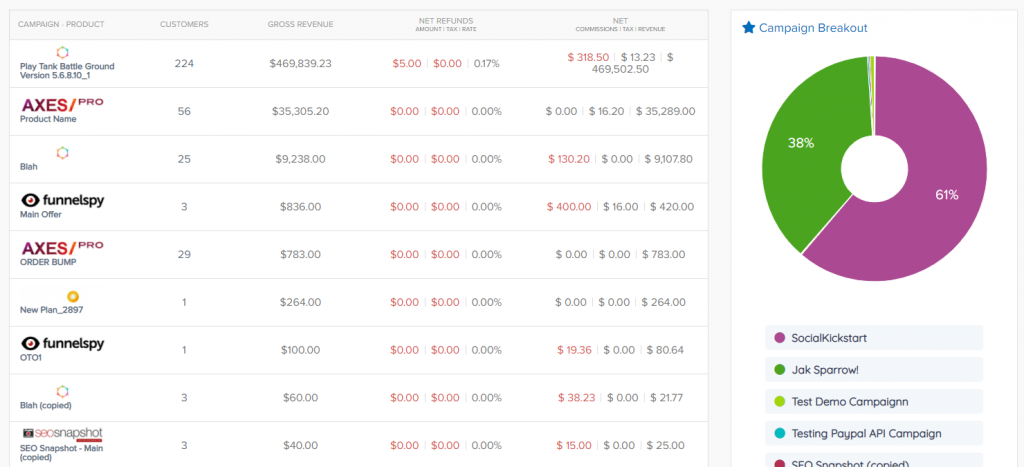
Campaign/Product: Name of related campaign and Product.
Customers: Customer purchase count
Gross Revenue: The total sales amount related to campaign/product before deducting refunds and commissions.
Refund Amount/Rate: Gross refunds for all transactions, including partner sales. % = Gross Refund Transaction Count / Gross Sales Count.
Net: Affiliate commissions related to campaign/product. VAT amount. Revenue = Gross sales minus refunds, commission and VAT.
Campaign Breakout:
Calculated by number of transactions per campaign and divide each campaign transaction count by the total transactions to equal the percentage
Reports >> Funnels
Link: https://app.paykickstart.com/admin/reports/vendor/funnels
Calculations:
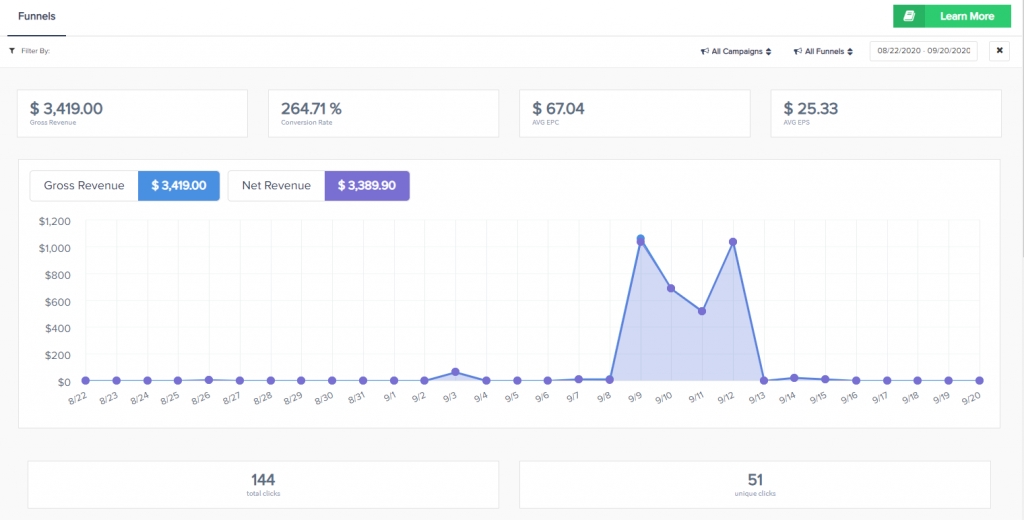
- EPC: Unique Clicks / Gross Sales
- EPS: Gross Sales Amount / Gross Sales Count
- Conversion Rate: Gross Sales / Unique Clicks
- Visits: Count of total and unique customers visits to the related landing page via the sales funnel.
- Checkout: Count of total and unique customers visits to the related checkout pages via the sales funnel.
- Sales: Gross revenue, sales counts of initial product purchases via the funnel, VAT charged.
- Sales Conversions:
– Checkout conversion rate(sales count / unique checkout visits ): conversation rate when a buyer lands on a checkout page.
– Sales conversion rate(sales count/unique clicks): conversion when a buyer lands on a landing page and proceeds to checkout and purchases.
– Earning per click, Earning per sale. - Refunds: Net Refund amount, Refund count, Refund rate
- Net Sales: The total sales amount after deducting refunds and commissions. Gross Revenue – (refunds + commissions) = Net Revenue This does not include free trials or subscription rebills or any products purchased outside of the sales funnel.
NOTE:
This report only considers the performance of each funnel based on traffic received and sales generated to that specific funnel. As such, it does not consider:
- Subscription rebills
- Sales from API calls
- Manual transactions
- Subscriptions which were imported
- Any other sale / traffic which is not directly associated to a funnel
- Sales from any product which is not present in a specific funnel (since funnel structures can change, the selected funnel structure can affect this)
- Any metrics relating to funnels associated to JV contracts
- $0 Transactions: We do not report $0-based transactions in the funnel report. This is to avoid skewing reporting stats such as EPC and EPS, which would be drastically affected by $0-based transactions.
NOTE: Please ensure that your vendor landing page tracking script is installed on all your landing pages and that your landing pages are properly defined, as this will affect your funnel’s metrics, particularly those affected by traffic/visit data.
Please also ensure each product being used in multiple sales funnels is using a unique landing page URL for the product in that funnel. using the same landing page URL for the same product in multiple funnels will skew reports.
Order bumps metrics are not tracked in this report.
Commission Reports
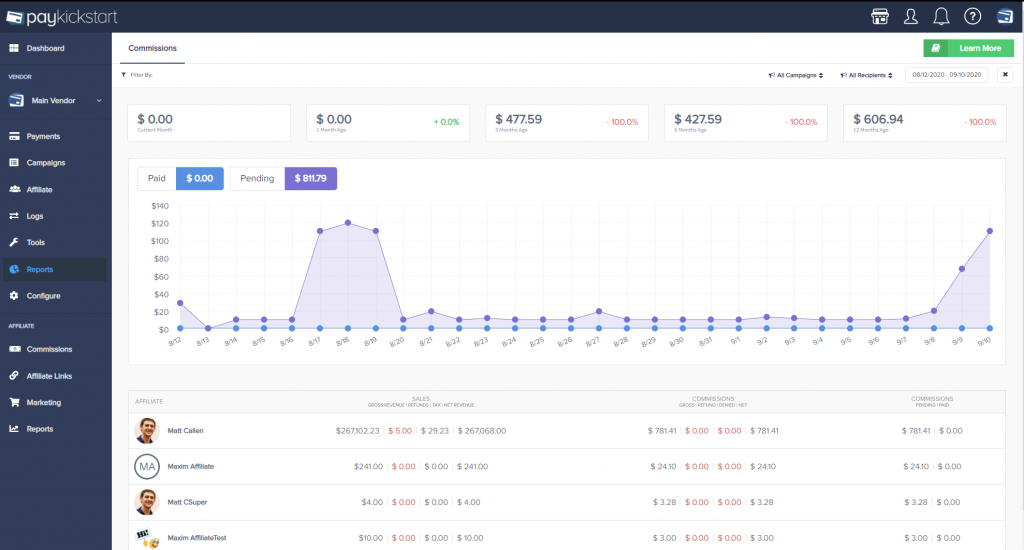
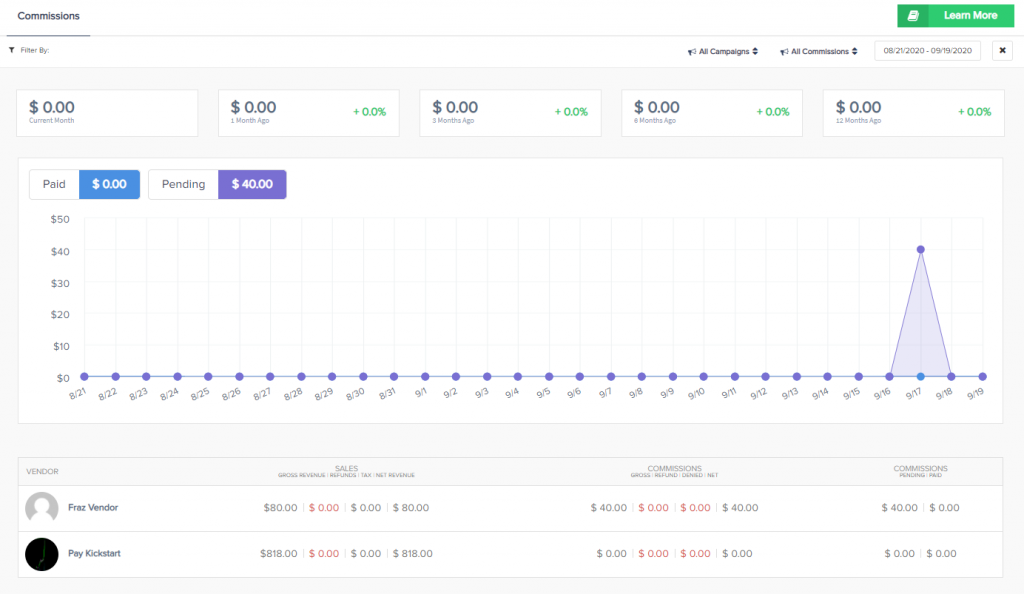
NOTE: The commission report does not factor lead commissions, only commission from actual transactions.
Reports >> Traffic
Link: https://app.paykickstart.com/admin/reports/vendor/traffic
Graph:
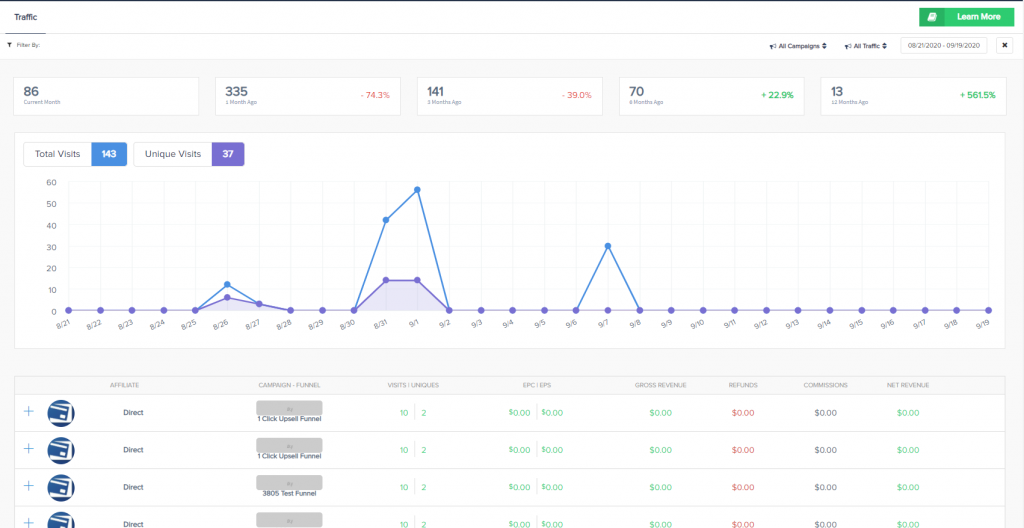
Traffic reports filter sales funnel traffic by Direct(no affiliate associated) and Affiliate related traffic on a all (or per) campaign basis. This includes traffic to campaigns which may have products in multiple funnels (i.e. if a campaign has products which exist in multiple funnels, the traffic from ALL funnels will be aggregated).
Rows:
Each record represents traffic totals broken down by campaign, funnel and affiliate (where applicable).
NOTE: The visit and unique counts in each record represent the values attributed to the frontend landing page of the relevant funnel. Since traffic metrics are based on landing page visits, if more than one funnel shares the same frontend landing page URL, they may display the same traffic metrics.
NOTE: The traffic report does not factor lead commissions, only commission from actual transactions.
Sub-Rows:
Each record represents traffic totals broken down by the individual products’ traffic within the funnel.
NOTE: If you have multiple products on the same step in the funnel, they may display the same traffic metrics.
Columns:
- Visits: Total number of customer visits to the main product landing page.
- Unique: Unique customer visits to the main product landing page.
- EPC: Unique Clicks / Gross Sales
- EPS: Gross Sales Amount / Gross Sales Count
- Gross Revenue: Total amount of sales recognized for a reporting period, prior to any deductions.
- Refunds: Refund amount related to the sales funnel traffic.
- Commissions: Commission amount related to the sales funnel traffic.
- Net Revenue: Total amount of sales recognized for a reporting period, after any deductions.
NOTE:
Traffic is measured in one of two ways:
- By landing page tracking script. The tracking script detects the current page URL and compares it to the landing page urls defined in affiliate funnel overrides, funnel overrides or product settings. For best results, ensure the URL matches exactly what’s defined in these settings, and toggle the “ignore query string” option as required.
- By Affiliate link clicks. In this case, as soon as the link is clicked the affiliate’s traffic report will reflect the click, and if the link redirects to a vendor landing page then the click is credited to the relevant vendor’s reports as well.
Reports >> Subscriptions
Link: https://app.paykickstart.com/admin/reports/vendor/subscription
NOTE: Imported subscriptions will only begin to reflect in the subscriptions report once they’ve charged at least once successfully.
History Totals

Refers to the total blocks displayed at the top of the reports (excluding funnels):
- Current month: Always taken from today’s date, backwards up to and including first day of the month. Selected Date range is ignored.
- X month(s) ago: Always taken from first day of the current month less count of months (X). Selected date range is ignored.
Gross Revenue
Total amount of paid subscription sales recognized for a reporting period, prior to any deductions.

Monthly Recurring Revenue (MRR)
Monthly recurring revenue is a projection of subscription revenue over the next 30 days (i.e. a 1 month period) based on the number of current active subscriptions, assuming that none of the active ones cancel and no new subscriptions are created during that time. It is calculated by adding up the value of all of your active subscriptions. Increases in MRR come from three places: new customers, returning customers, and upgrading customers. Conversely, you can lose MRR to cancellations and downgrades.
Subscriptions using “days” or “years” as the frequency type have their values standardized for the MRR calculation as follows:
- Days: Subscription amount x 365.25 / 12
- Years: Subscription amount / 12

Starting from June 25th, 2022, MRR reports will now consider discounts(coupons) related to subscription rebills into account. Permanent coupons applying to rebills, or ones with a limited number of rebill payments will be considered for projecting MRR. Please note that this does not affect historic records, but only records from this date forward.
Active Subscription count
Count of active(paid) subscriptions in the filtered time period.

The Subscription count in the report does not count trialing subscriptions. The MRR and Churn values are based on the Subscription count as well.
Churn Rate
Churn rate is calculated as follows: [ Count of all canceled subscriptions in 30 days prior to date x 100 ] / [ Count of active subscriptions 30 days prior to date ]

Product Breakdown
Campaign/Product: The related campaign and product.
Subscription: the recurring billing frequency.
Created: Paid subscriptions that were created and up to the filtered time period.
Canceled: subscriptions that were canceled or completed up to the filtered time period.
MRR: Product breakdown of MRR section above.

Reports >> Trial Subscriptions
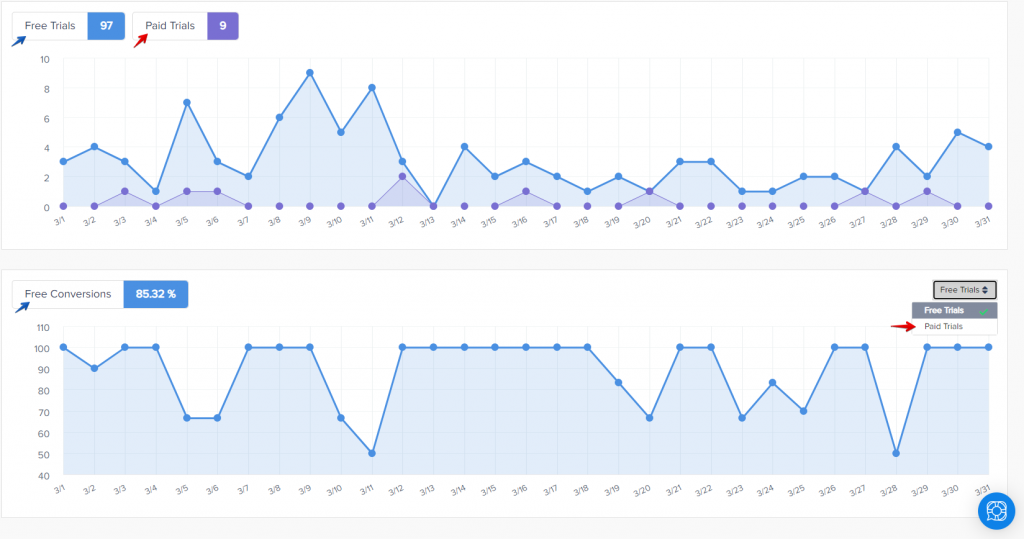
The Trial Subscriptions report shows the total number of trials started within the specified date range and the number of subscriptions that have matured (converted) either from Free or Paid Trials (if offered within your pricing structure).
Subscription section CSV exports and subscription reports will not match verbatim as these sections are showing information based on different logic described below:
#1: Subscription section export files: Show export records based on the date period filter and subscription status selected. They will produce records based on the current status of the subscription. EX: if the subscription is now canceled, it will not show if you filter for a previous date rage and selecting “Created(active)” status. Subscription Reports show records based on the status of a subscription at that point in time (using the filtered date range). EX: if a subscription is now canceled, but was active during the date period being used with the report filter, then the report would count it as an active subscription because it was at that time.
#2: Subscriptions section and CSV exports show ALL subscriptions, including test mode subscriptions. Subscription reports only show live customer subscriptions.
#3: Trial consideration in Subscription related reports
We only mark a trial as successfully converted (i.e. not in trial anymore and has successfully converted into a regular subscription) after we receive the first successful charge after the trial end date.
For example, if a customer purchases a free trial for 14 days on 1st of January, then on 14th of January their rebill transaction fails. In this case, the report does NOT consider the trial as matured(converted).
In 3 days, the system tries charging the customer again via a dunning attempt, and the payment happens to fail again. The report still does NOT consider the trial as matured(converted).
This can continue until either the rebill succeeds (at which point the trial will be marked as matured(converted), or fails (at which point the trial will be marked as canceled).
The same is true if the vendor changes the next charge date for the first rebill (manually edits the next charge date).
This can affect the Subscription count, MRR (Monthly Recurring Revenue) and Churn stats in the subscriptions report, as well as the Trial Subscription report.
Affiliate Reports
Affiliate Dashboard
Link: https://app.paykickstart.com/affiliate-dashboard
Payment Frequency:
- One time: Net One-time transaction commissions
- Recurring: Net Recurring transaction commissions

Traffic Summary:
Analysis of top 5 products’ traffic, determined by all visits to each products’ landing page(s) which originated from the logged in affiliate (visitor has the affiliate’s cookie set).
NOTE:
- Products may appear to have the same traffic values if those products share the same landing page.
- One affiliate link click may be responsible for traffic to multiple products, as there are multiple products in the funnel.
Best Performing Products:
- Sales: Net commissions count
- Revenue: Net commissions count amount

Reports >> Sales
Link: https://app.paykickstart.com/admin/reports/affiliate/sales
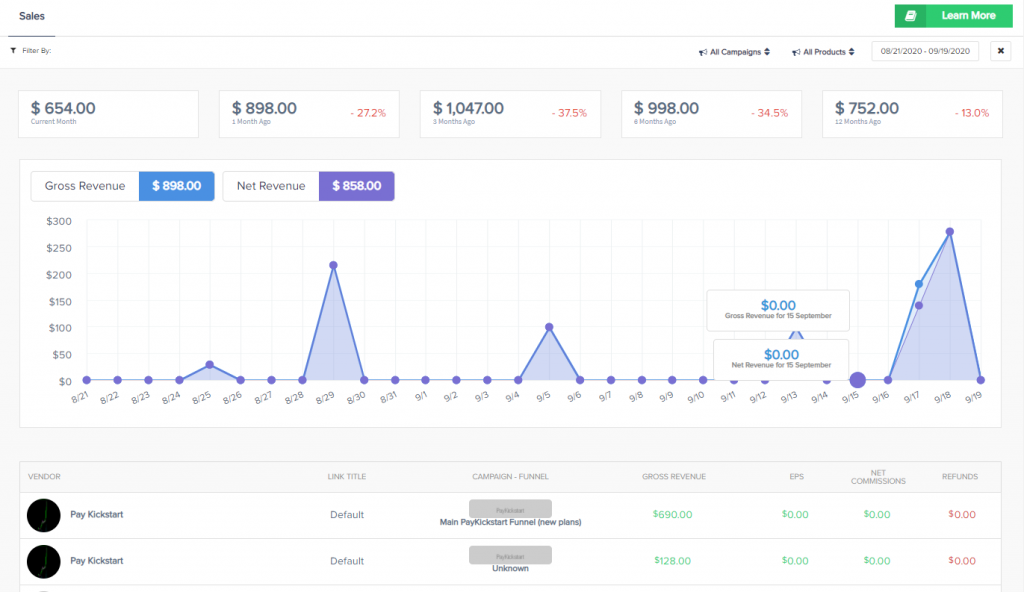
- Net Sales: Total Sales – Refunds
- EPS: Gross commissions / gross commissions count (for approved AND refunded transactions)
- Commissions: Net Commissions
Report Layout:
Based on the date range selected, reports can show in the following format:
>=1 day to <=31 days Displays in days
>1 month (ie more than 31 days) to <=5 months Displays in weeks
>=6 months to <=12 months Displays in months
>12 months Displays in years
Reports >> Funnels
Link: https://app.paykickstart.com/admin/reports/affiliate/funnels
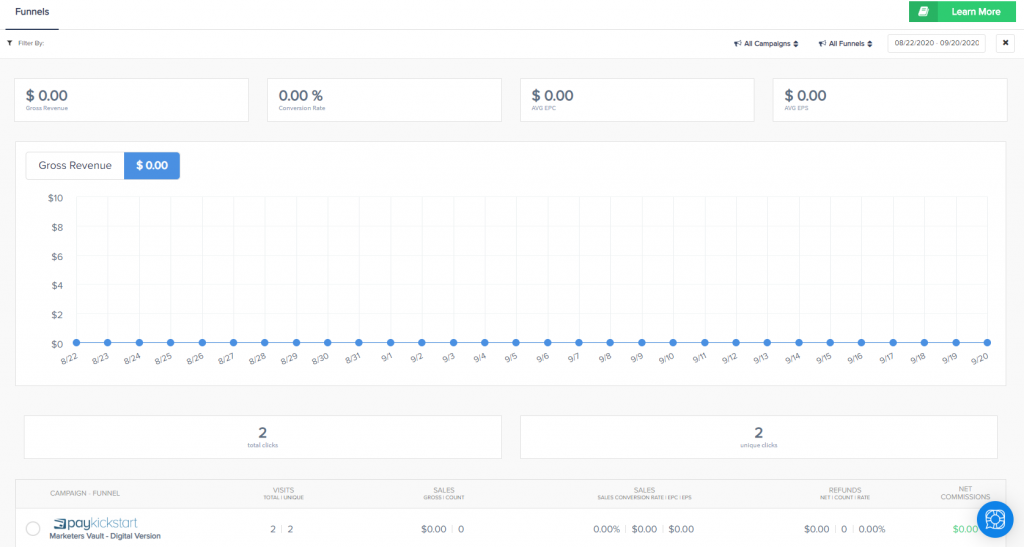
NOTE: This report does not take any subscription rebills into account. It only considers the performance of each funnel based on traffic received and sales generated.
- Net Sales: Total Sales – Refunds
Reports >> Commissions
Reports >> Traffic
Link: https://app.paykickstart.com/admin/reports/affiliate/traffic
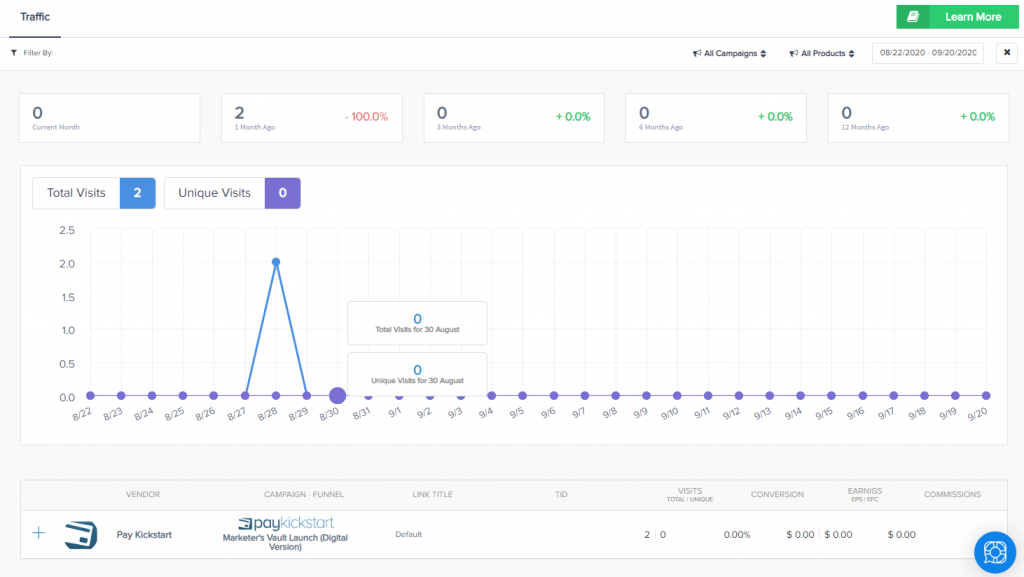
ROWS:
Each record represents traffic totals broken down exclusively by Affiliate link clicks.
SUB-ROWS:
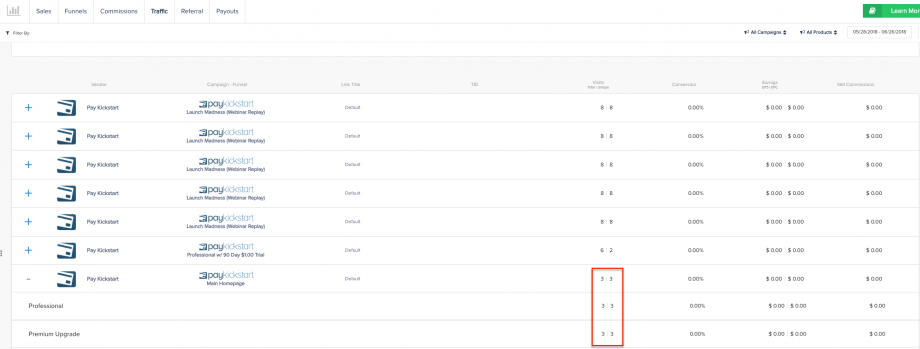
Each record represents traffic totals generated by the affiliate (visitor has the affiliate’s cookie set) for each of the vendor’s funnel’s products’ landing pages. It is also broken down by the state of the funnel (e.g. if the funnel structure changes in the selected date range, there may be more than 1 subset of data displayed for each funnel structure state.)
NOTE:
- One affiliate link click may be responsible for traffic to multiple products, as there are multiple products in the funnel.
- It is also possible for sub-rows to reflect LESS traffic if there’s an issue with the vendor’s visitor tracking (e.g. tracking script not installed, landing page URL differs from product settings etc.) – see Vendor Reports->Traffic for more information.
COLUMNS:
- Conversion rate = Gross sales count / Unique visits count
- NOTE: It’s possible for affiliate link clicks to not equal the sum of the traffic of all the associated funnel’s products. This can happen, for example, if multiple products are listed in the same step in the funnel. In this case, each product sharing the same step will be attributed with the same visit. Another example is if an affiliate creates a custom link and overrides the destination URL. In this case, the link metrics will provide data for the link clicks itself, and the breakdown will provide metrics for traffic generated for that link’s associated funnel’s landing page URLs.
Reports >> Payouts
Link: https://app.paykickstart.com/admin/reports/affiliate/payout
- Paid = Commissions paid out to the affiliate
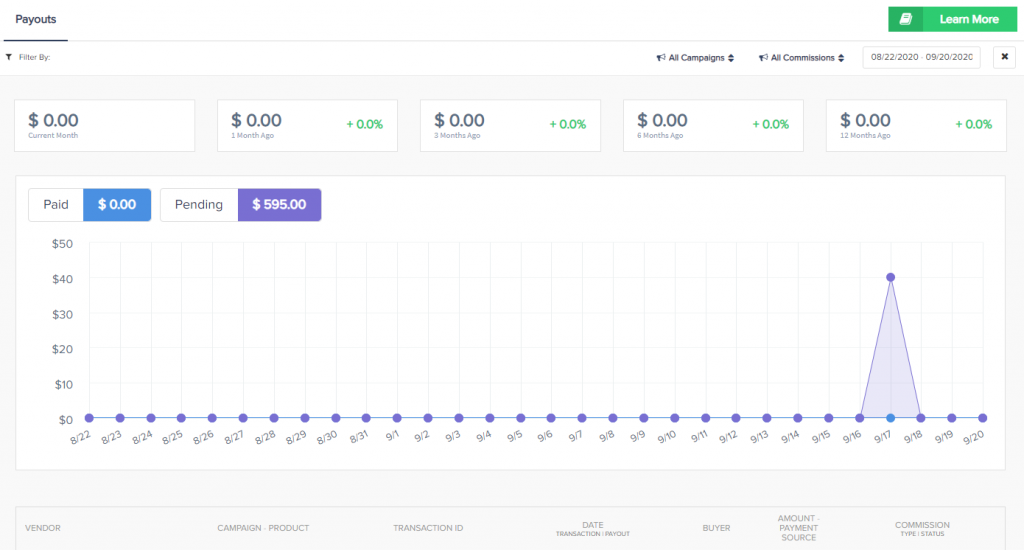
- Pending = Commissions waiting to be paid by the vendor
